Mapbox API Web Application
Developed a Minimum Viable Product for a startup idea called Mappa, a startup concept focused on visualizing current events through interactive charts, graphs, and maps.
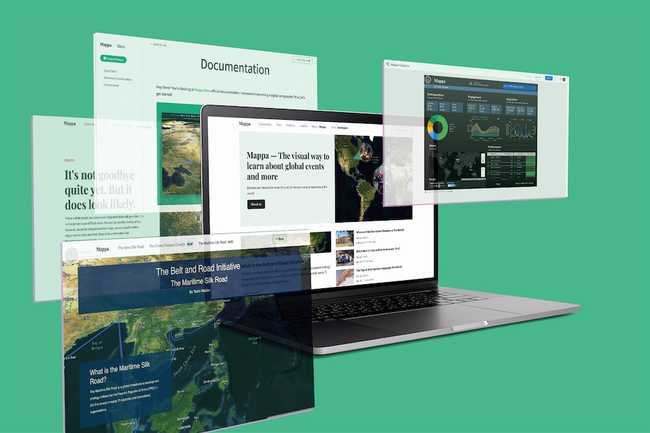
View the live project: Mappa News
Summary
According to Learning Theory Research, nearly 65% of the general population are visual learners, meaning they need to see information in order to retain it.
This prompted the creation of Mappa: utilizing graphs, charts, maps, and other forms of visual stimulation to effectively illustrate current events and global news. To stand up a minimum viable product for my "million dollar idea", I deduced it would be the most efficient to use HTML, CSS, and Vanilla JavaScript to create the blog, and utilize existing JavaScript Libraries like MapBox GL JS.
"Mapbox GL JS is a client-side JavaScript library for building web maps and web applications with Mapbox's modern mapping technology. You can use Mapbox GL JS to display Mapbox maps in a web browser or client, add user interactivity, and customize the map experience in your application."
Featured Articles
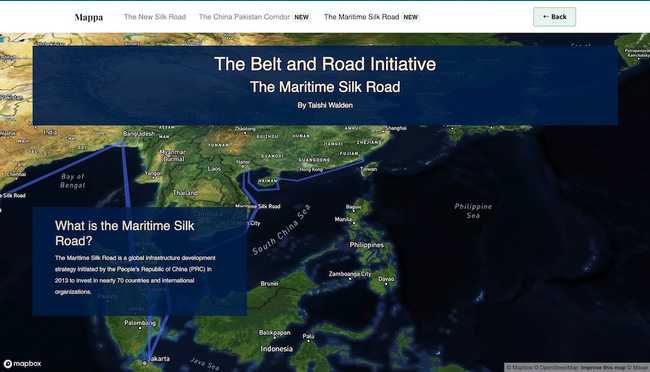
China’s President Xi Jinping unveiled The Initiative in 2013, and it is often referred to as one of the most ambitious infrastructure projects ever conceived.. View the BRI article here.
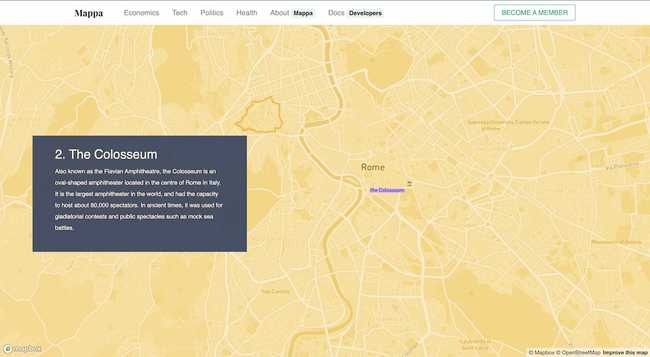
Given that the original Seven Wonders list was compiled in the 2nd century BCE, it seemed time for an update. View the 7 World Wonders article here.
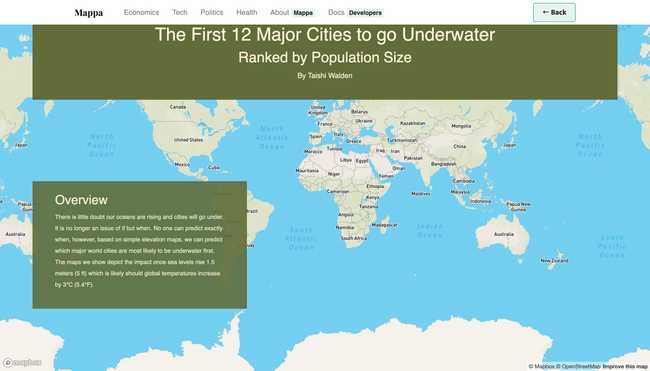
There is little doubt our oceans are rising and cities will go under. It is no longer an issue of if but when. View the Underwater Cities article here.
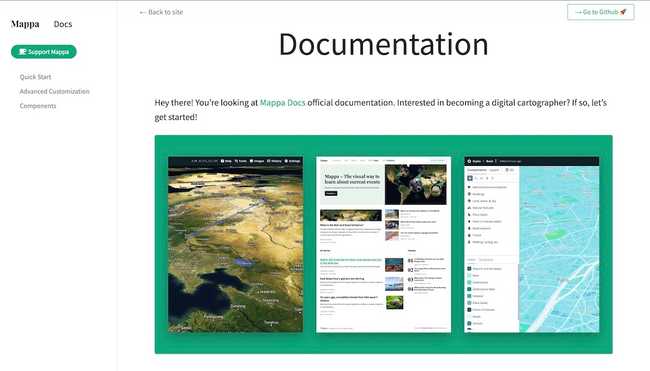
Documentation
Although Mappa was initially built with the idea of giving visual learners more exposure to international relations and global politics, I developed a documentation page so that people could create interactive maps for other purposes–like mapping their study abroad program or travel plans.
Analytics
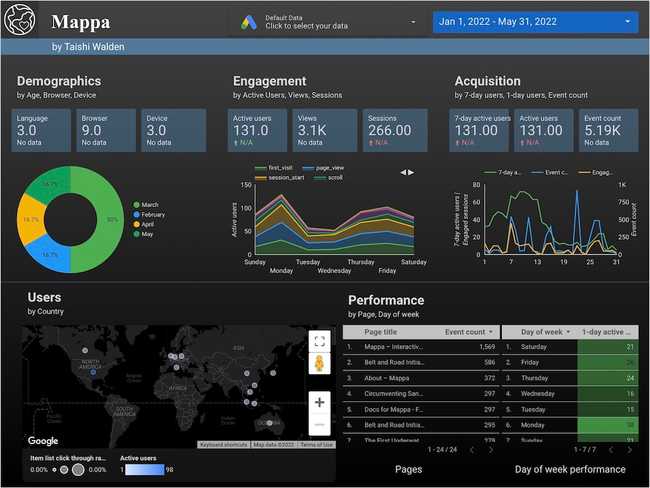
To measure the popularity of the project, I used Google Analytics to track web traffic, average time spent on the page, number of active users, as well as other key digital marketing indicators. I built a dashboard on Google Data Studio to allow for easy interpretation.
Skills
- HTML, CSS, JavaScript
- Mapbox Studio
- Mapbox GL JS
- Netlify
- Google Analytics